16.4 Weather Forecasting
16.4 Weather Forecasting
Lesson Objectives
- State how meteorologists predict the weather.
- Outline how technology and computers are used to forecast the weather.
- Describe what weather maps show.
Vocabulary
- anemometer
- barometer
- hygrometer
- meteorologist
- rain gauge
- snow gauge
- thermometer
- weather balloon
- weather map
- weather satellite
- weather station
- wind vane
Introduction
Did you ever have a picnic ruined by a surprise rainstorm? People often complain when the weather forecast is wrong. But in fact, weather forecasts today are much more accurate than they were just 20 years ago. Scientists who study and forecast the weather are called meteorologists. How do they predict the weather?
Predicting the Weather
Weather is very difficult to predict. That’s because it’s very complex and many factors are involved. Slight changes in even one factor can cause a big change in the weather. Still, certain “rules of thumb” generally apply. These “rules” help meteorologists forecast the weather. For example, low pressure is likely to bring stormy weather. So if a center of low pressure is moving your way, you can expect a storm.
Technology and Computers
Predicting the weather requires a lot of weather data. Technology is used to gather the data and computers are used to analyze the data. Using this information gives meteorologists the best chance of predicting the weather.
Weather Instruments
Weather instruments measure weather conditions. One of the most important conditions is air pressure, which is measured with a barometer. Figure below shows how a barometer works. There are also a number of other commonly used weather instruments (see Figure below):
- A thermometer measures temperature.
- An anemometer measures wind speed.
- A rain gauge measures the amount of rain.
- A hygrometer measures humidity.
- A wind vane shows wind direction.
- A snow gauge measures the amount of snow.
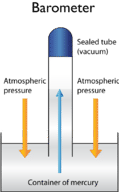
The greater the air pressure outside the tube, the higher the mercury rises inside the tube. Mercury can rise in the tube because there’s no air pressing down on it.

Some of the most commonly used weather instruments. (a) Thermometer: temperature, (b) Anemometer: wind speed, (c) Rain gauge: amount of rain, (d) Hygrometer: humidity, (e) Wind vane: wind direction, (f) Snow gauge: amount of snow.
Collecting Data
Weather instruments collect data from all over the world at thousands of weather stations. Many are on land but some float in the oceans on buoys. You can see what a weather station looks like in Figure below. There’s probably at least one weather station near you.
Other weather devices are needed to collect weather data in the atmosphere. They include weather balloons, satellites, and radar. You can read about them in Figure below.

Weather stations collect data on land and sea. Weather balloons, satellites, and radar collect data in the atmosphere.
Weather stations contain many instruments for measuring weather conditions. The weather balloon in Figure above will rise into the atmosphere until it bursts. As it rises, it will gather weather data and send it to the surface. Many weather satellites orbit Earth. They constantly collect and transmit weather data from high above the surface. A radar device sends out radio waves in all directions. The waves bounce off water in the atmosphere and then return to the sender. The radar data shows where precipitation is falling. It’s raining in the orange-shaded area shown above.
Using Computers
What do meteorologists do with all that weather data? They use it in weather models. The models analyze the data and predict the weather. The models require computers. That’s because so many measurements and calculations are involved.
Weather Maps
You may have seen weather maps like the one in Figure below. A weather map shows weather conditions for a certain area. The map may show the actual weather on a given day or it may show the predicted weather for some time in the future. Some weather maps show many weather conditions. Others show a single condition.

This weather map shows air pressure contours. Which state has the lowest air pressure shown on the map?
Air Pressure Maps
The weather map in Figure above shows air pressure. The lines on the map connect places that have the same air pressure. Air pressure is measured in a unit called the millibar. Isobars are the lines that connect the points with the same air pressure. The map also shows low- and high-pressure centers and fronts. Find the cold front on the map. This cold front is likely to move toward the northeast over the next couple of days. How could you use this information to predict what the weather will be on the East Coast?
Other Weather Maps
Instead of air pressure, weather maps may show other weather conditions. For example, a temperature map might show the high and low temperatures of major cities. The map may have isotherms, lines that connect places with the same temperature.
Lesson Summary
- Weather is very complex. This makes it hard to predict. Certain “rules” can help. For example, low pressure brings stormy weather.
- Weather instruments measure weather factors. Weather stations collect data on Earth’s surface. Weather balloons, satellites, and radar collect data in the atmosphere. Computer models analyze the data and help predict the weather.
- A weather map shows the weather for a certain area. It can show actual or predicted weather. It may show a single weather condition or more than one.
Lesson Review Questions
Recall
1. Why is weather difficult to predict?
2. List three weather instruments, and state what they measure.
3. What is the role of weather balloons and weather satellites?
4. What does a weather map show?
5. Define isobars and isotherms.
Apply Concepts
6. What concepts explain how a barometer works?
7. In the weather map in Figure above, where is the weather most likely to be clear and dry? How do you know?
Think Critically
8. Explain how radar could be used to track an approaching thunderstorm.
Points to Consider
In this chapter you learned about weather. Weather is sometimes confused with climate. The two are related but not the same.
- What is climate?
- How does climate differ from weather?
- Log in or register to post comments
- Email this page